Kubernetes Monitoring with Prometheus and Grafana
Kubernetes Monitoring with Prometheus and Grafana
This project monitors a Kubernetes microservices architecture using Prometheus and Grafana. It covers microservices, Redis, and a Node.js application.
Table of Contents
Introduction
I set up monitoring for a Kubernetes-based microservices application using Prometheus and Grafana. This included configuring alerts, monitoring a Redis instance, and tracking metrics from a Node.js application. The goal was to create a comprehensive monitoring solution for a typical Kubernetes environment.
Technologies Used
- Kubernetes: Orchestration.
- Prometheus: Metrics.
- Grafana: Visualization.
- Redis: Data store.
- Node.js: App runtime.
- Helm: Package manager.
Prerequisites
- AWS EKS Cluster
- Helm.
Installation
-
Create Namespace:
kubectl create namespace monitoring -
Install Prometheus Stack:
helm repo add prometheus-community https://prometheus-community.github.io/helm-charts
helm repo update
helm install prometheus-monitoring prometheus-community/kube-prometheus-stack -n monitoring
Usage
-
Prometheus UI:
kubectl port-forward svc/prometheus-monitoring-kube-prometheus 9090:9090 -n monitoring(
http://localhost:9090). -
Alertmanager UI:
kubectl port-forward svc/prometheus-monitoring-kube-alertmanager 9093:9093 -n monitoring(
http://localhost:9093). -
Grafana Dashboard:
kubectl port-forward -n monitoring svc/prometheus-monitoring-grafana 3000:80(
http://localhost:3000).
Project Description (Tasks)
Alerting System Testing
-
Description: Tested alert rules for CPU and pod failures, visualized in Grafana.
- Goal: Verify Prometheus and Alertmanager setup.
-
Procedure:
- Apply Configs:
(Applies Prometheus rules and Alertmanager configuration)kubectl apply -f alert-rules.yaml -n monitoring kubectl apply -f alert-manager-config.yaml -n monitoring - Simulate CPU Load:
kubectl run cpu-test --image=containerstack/cpustress -- --cpu 4 --timeout 60s --metrics-brief. (Creates CPU load) - Observe Alerts: In Prometheus UI, check the "Alerts" section. (Check for
HostHighCpuLoadalert)
Screenshot: Prometheus UI showing the
HostHighCpuLoadalert.
- Simulate Pod Failure: Deploy a pod with an invalid image. (Causes pod crashloop)
- Observe Alerts: In Prometheus UI, check the "Alerts" section. (Check for
PodCrashloopalert) - Grafana: Create dashboard. (Visualize CPU, pod status)
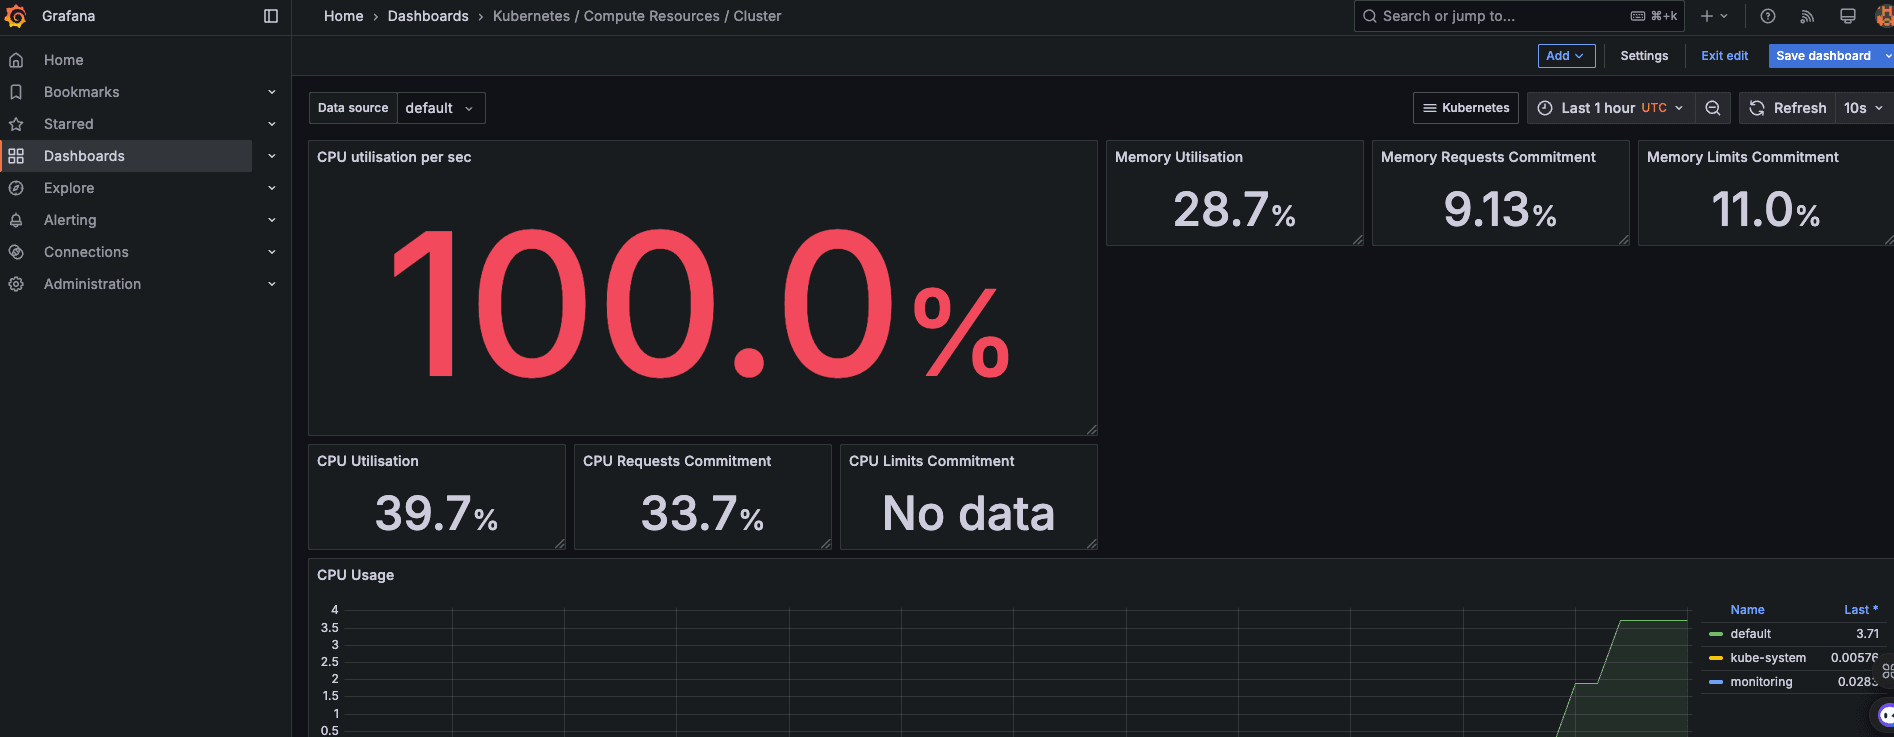
Screenshot: Grafana dashboard showing CPU usage and pod status.

- Apply Configs:
Redis Monitoring
-
Description: Monitored Redis, including alert rules, visualized in Grafana.
- Goal: Verify Redis monitoring and alerting.
-
Procedure:
- Install Exporter:
(Deploys Redis Exporter)helm repo add prometheus-community https://prometheus-community.github.io/helm-charts helm repo update helm install redis-exporter prometheus-community/prometheus-redis-exporter -f redis-values.yaml -n monitoring - Apply Rules:
kubectl apply -f redis-alert-rules.yaml -n monitoring. (Applies Prometheus rules) - Verify Exporter: In Prometheus UI, check the "Targets" section. (Confirm Exporter target)
Screenshot: Prometheus Targets with Redis Exporter

- Simulate Redis Down:
kubectl scale deployment redis --replicas=0 -n monitoring. (Scale Redis to 0) - Observe Alerts: In Prometheus UI, check the "Alerts" section. (Check for
RedisDownalert)
Screenshot: Prometheus UI showing the
RedisDownalert.
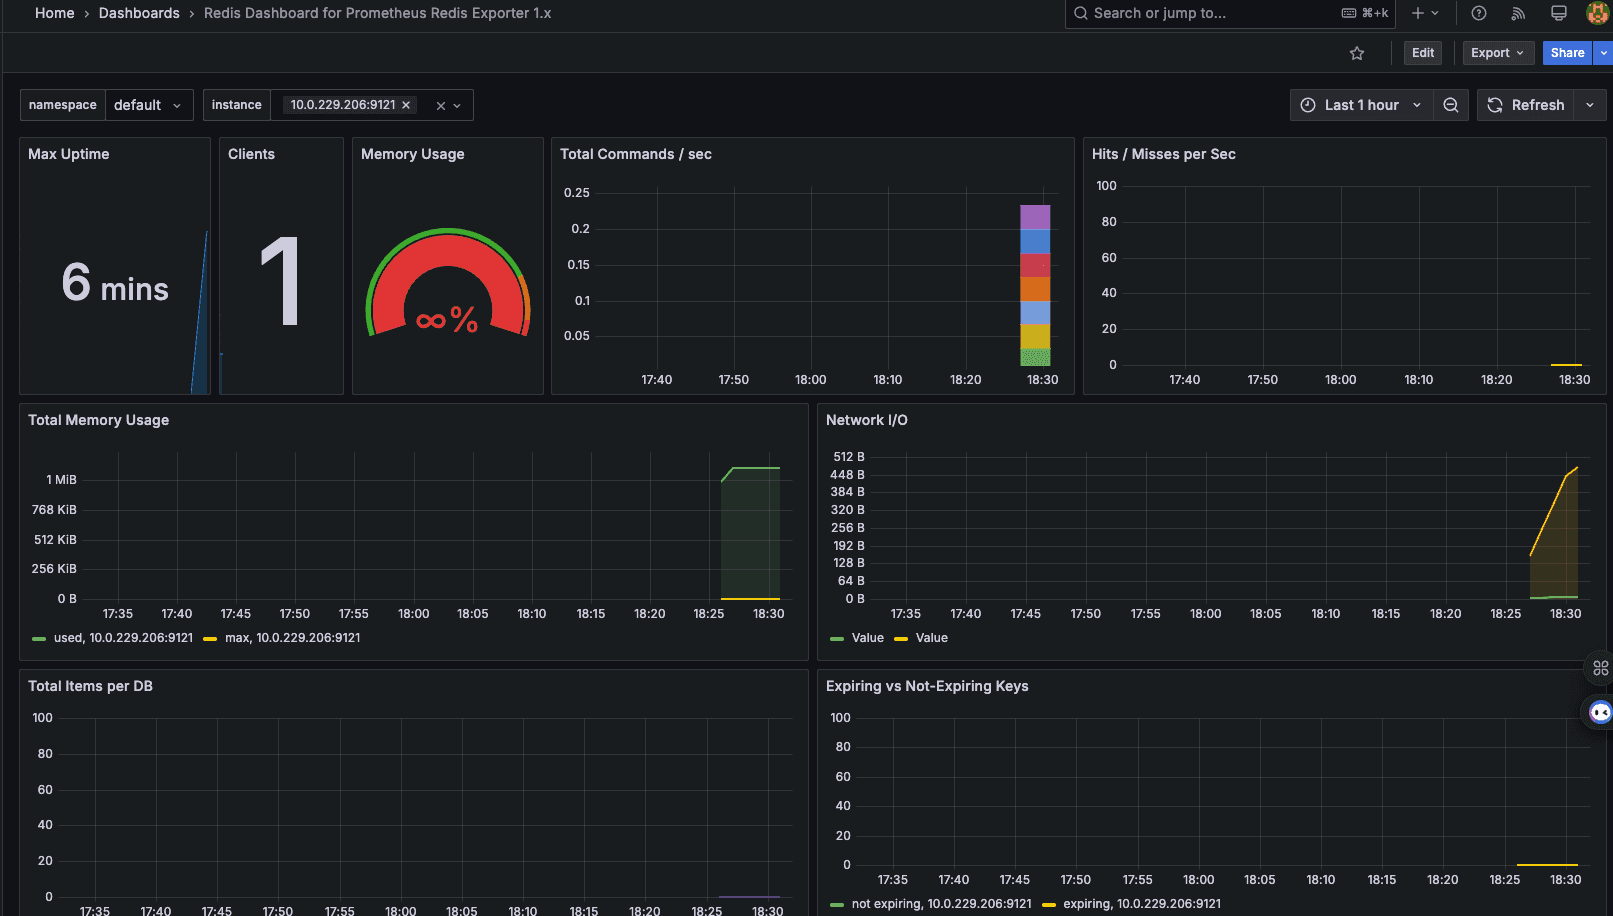
- Grafana: Create dashboard. (Visualize Redis metrics)
Screenshot: Grafana dashboard showing Redis metrics.

- Restore Redis:
kubectl scale deployment redis --replicas=2 -n monitoring. (Restore Redis scale)
- Install Exporter:
Node.js App Monitoring
-
Description: Monitored a Node.js app with Prometheus and visualized in Grafana.
- Goal: Verify custom application monitoring.
-
Procedure:
- Deploy App:
kubectl apply -f node-js-app-monitoring-k8s-config.yaml -n monitoring. (Deploys Node.js app) - Access App: Determine IP/port.
(
kubectl get service) - View Metrics:
http://<ip>:<port>/metrics. - Verify Exporter: In Prometheus UI, check the "Targets" section.
- Grafana: Create dashboard.
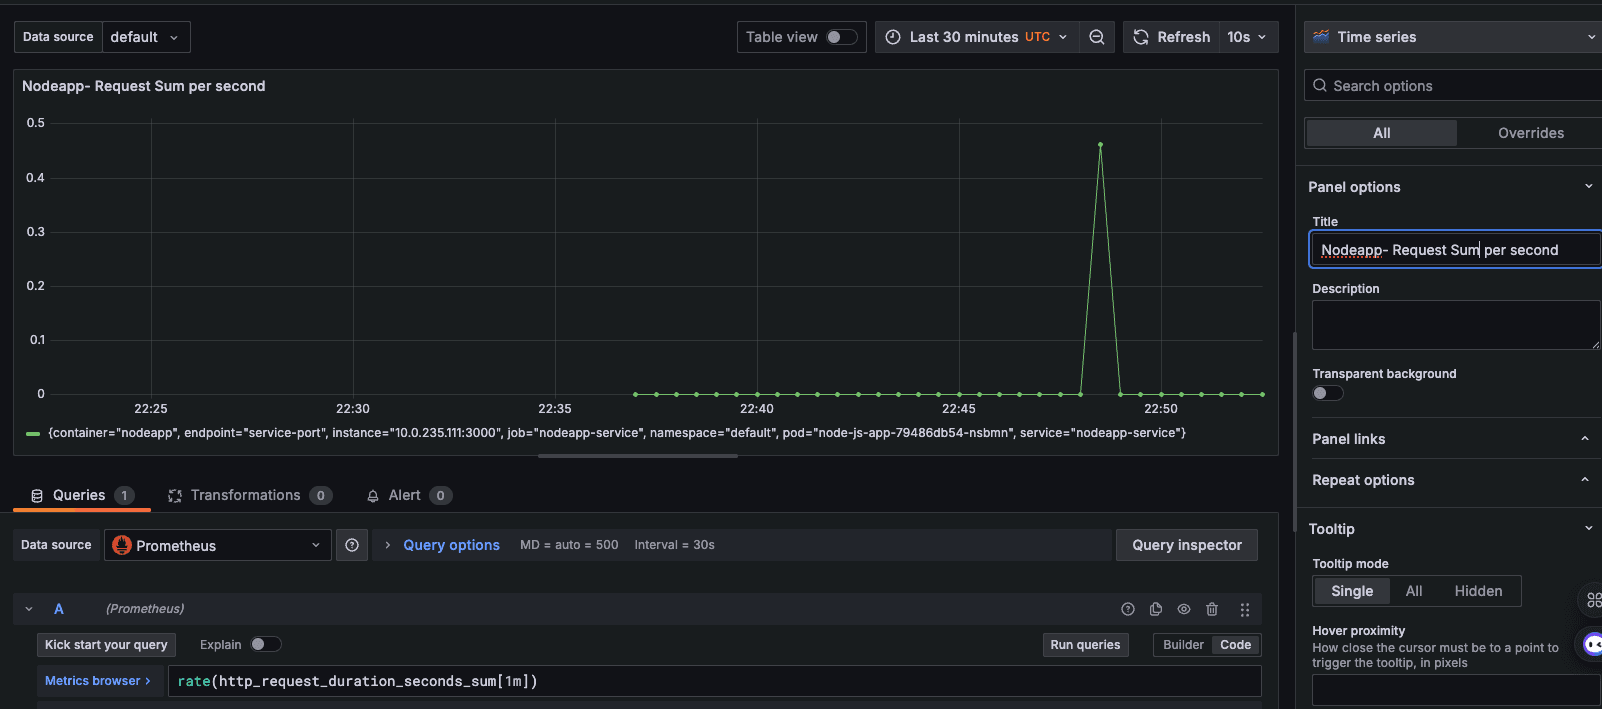
Screenshot: Grafana dashboard showing Node.js application request duration.
 Screenshot: Grafana dashboard showing Node.js application request total.

- Deploy App:

